Massachusetts Voting Demographics
What factors played into whether a City/Town voted for Trump or Clinton? Explore different demographic variables and how they correlate with votes
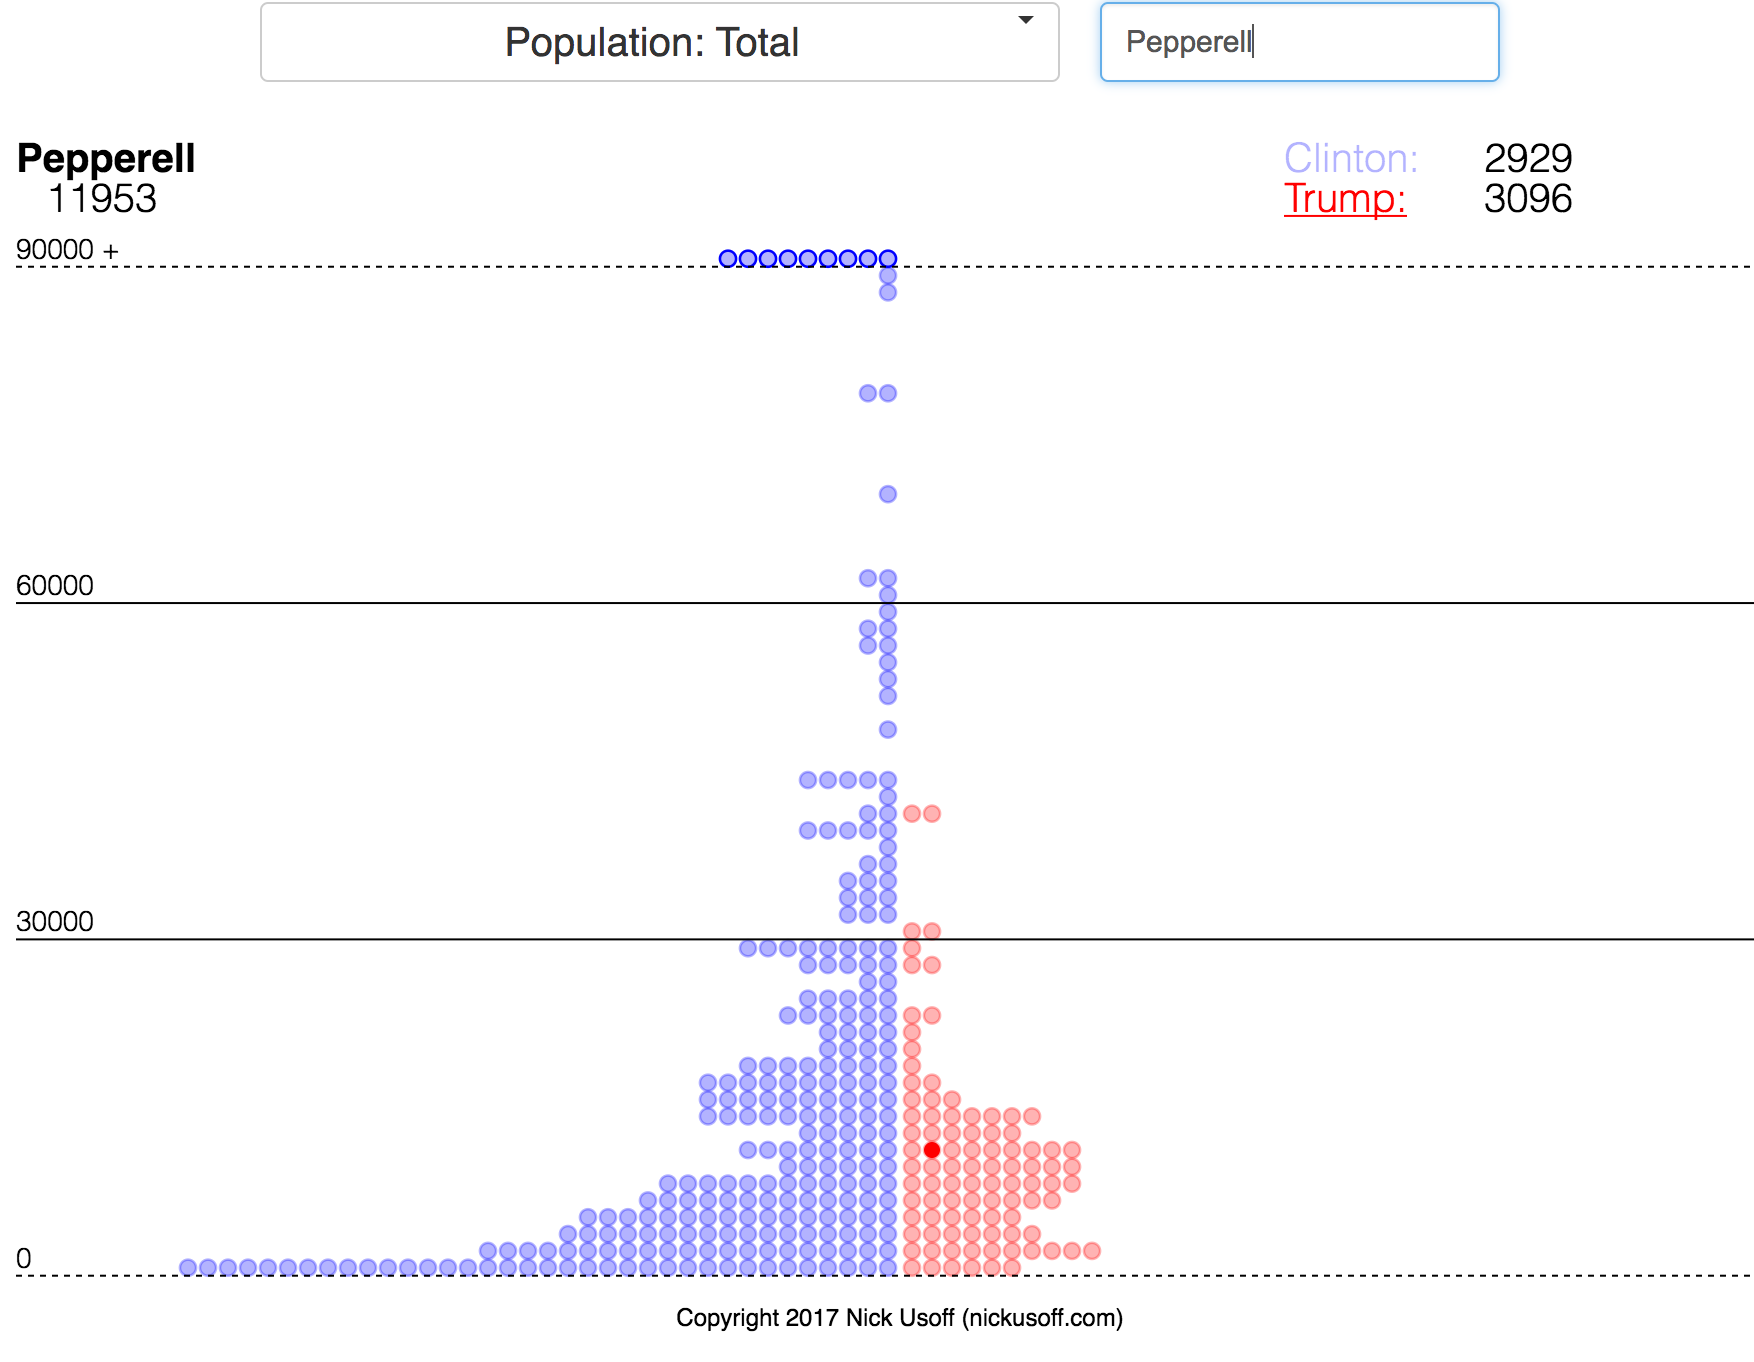
Circles represent cities or towns. Left of center and blue circles are places which voted for Clinton, right or center and red indicates a place voted for Trump. Since this graph acts as a horizontal histogram, the precise x-position is meaningless.
Select a Demographic Variable (age, race, income, etc.) from the dropdown to set the Y-axis: larger values are at the top. The dotted lines on the axis represent the boundaries of the histogram, any value beyond is placed adjacent to the boundary line, even if its true value is far from the boundary
Places can be selected by either mousing over a circle, or entering the place name in the search box. Selected nodes show up as a darker blue or red